
A composition table is not read like a product sheet: it is a sorting tool that, when properly utilized, eliminates the majority of unsuitable references even before opening the bag. Here, we detail the reading points that truly influence a choice.
Energy density in kcal/kg: the criterion that the table often conceals
Most guides focus on percentages of protein and fat. We recommend starting with the energy density expressed in kcal/kg. A food labeled with 30% crude protein can provide a very different caloric ration depending on its starch and fat content.
Brands are starting to specify this value directly on the composition table. When it is absent, it should be requested from the manufacturer or calculated using modified Atwater factors. Without this data, comparing two kibbles is like comparing two fuels without knowing their calorific value.
For a neutered or overweight dog, energy density determines the size of the daily ration. A very dense food requires a reduction in portion size, which can frustrate the animal and complicate adherence to the feeding plan. Consulting a dog kibble composition table that includes calories per kilogram allows for ranking references on a comparable basis.
Convert analytical constituents to dry matter before comparing

The rates displayed on the label are expressed as is, meaning with the product’s residual moisture. A kibble containing about 8% moisture and a pâté at 75% moisture should never be directly compared. Conversion to dry matter is a non-negotiable prerequisite.
The formula is simple: divide the declared value by (100 minus the moisture rate), then multiply by 100. A crude protein rate displayed at 25% on a food with 10% moisture gives about 27.8% in dry matter. Without this conversion, a wet food always appears poorer than a dry food, which skews judgment.
We observe that the majority of choice errors stem from comparisons made on raw values. A composition table only has value when brought back to a common base.
Carbohydrate levels in kibbles: the calculation that the label does not do for you
European regulations do not require the display of carbohydrate levels. It must be deduced by subtracting from 100 the percentages of crude protein, crude fat, crude fiber, crude ash, and moisture. The residue corresponds to the non-nitrogenous extract, mainly starch.
This calculation reveals considerable discrepancies between products presented as equivalent. Some ranges displaying a correct protein rate compensate with a high carbohydrate load, often linked to a significant proportion of grains or starches.
- Add crude protein, crude fat, crude fiber, crude ash, and moisture as indicated on the label
- Subtract this total from 100 to obtain the estimated carbohydrate level
- Compare this result among several references converted to dry matter for a reliable ranking
An excessive carbohydrate level can be problematic for sedentary dogs or those predisposed to diabetes. This is precisely the type of information that a well-read composition table allows you to detect, while the packaging highlights other arguments.
Complete or complementary food: a mention that changes the reading of the table
Since the recent revisions of the FEDIAF code of good practices, European manufacturers are strongly encouraged to clearly display the mention “complete food” or “complementary food” as well as the targeted life stage. This distinction is often overlooked by buyers.
A complementary food, even with an appealing analytical profile (high protein, low ash), does not cover all nutritional needs. Using it as the main ration exposes to deficiencies in vitamins or trace elements that the analytical constituents table does not directly indicate.
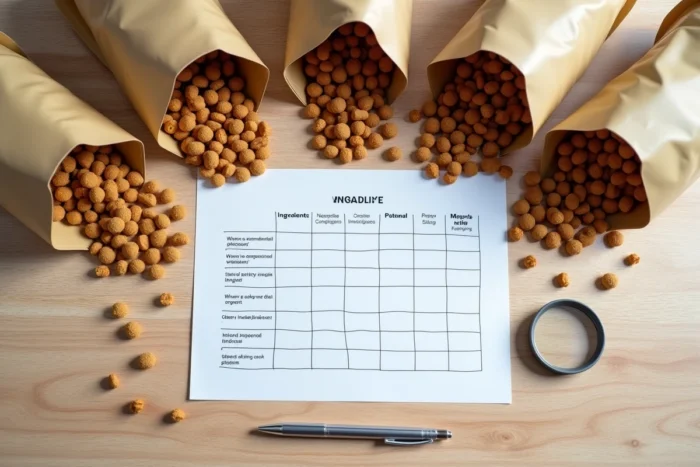
Always check this mention before interpreting the numbers. A composition table does not have the same significance depending on whether it describes a complete food for adult dogs or a complement intended to be mixed with another food source.
Raw materials and the order of the ingredient list: what the weight ranking does not say
Ingredients are listed in descending order of weight before processing. This ranking introduces a known bias: raw materials high in water weigh more before cooking. “Fresh chicken” at the top of the list may represent less actual protein than “poultry meal” listed in second position, as fresh meat loses a significant portion of its weight during cooking.
- Distinguish fresh meat (high water content) from animal meal (already dehydrated, more concentrated in protein)
- Identify the splitting of grains: “wheat,” “wheat meal,” “wheat gluten” listed separately can, when added together, exceed the animal protein source
- Identify generic terms (“animal by-products,” “grains”) that signal a lack of traceability regarding the actual quality of the ingredients
Splitting is the most frequent trap. Mentally grouping raw materials of the same origin gives a much more accurate picture of the recipe than a linear reading of the list.
Reading a composition table requires a systematic reflex: convert to dry matter, calculate the carbohydrates absent from the label, check caloric density, and verify the complete food mention. These four operations take less than a minute per reference and eliminate the majority of products poorly suited to your dog’s metabolic profile.